Google’s success story is well-known throughout the world. Their services are used and appreciated all over the world. In this article, we will examine the top Google Play Store app statistics for 2020-2021, as well as how they affect the lives of users and businesses around the world.
When it comes to technology, there is never a dull moment, and it promises to thrive for as long as we can imagine. What began with the invention of the wheel has progressed to the point where everything we want to do or have is now just a click or a tap away.
Engineers with extraordinary abilities pioneered Mobile App Development, which transformed the world as we know it. With the introduction of apps, many minds rose to take the initiative of taking this domain to the next level. Google is one such player that has transformed the technology industry in numerous ways. It was its products that made all the difference.
Google Play Store was earlier known as the “Android Market”
Not that you didn’t already know, but let us state the obvious – Google Play is a Digital Distribution Service offered by Google LLC. It is a platform that allows Android users to download apps directly from the Google Play store. These apps can range in size from 10MB to 4GB.
There are millions of mobile applications to try, so you won’t be short on options. Furthermore, the Google Play Store serves as an excellent platform for experienced Android app developers to showcase their work and gain a wider customer base. In short, the Google Play Store is ideal for both app users and app creators.
To back up the preceding statement, let us take a look at some impeccable and top Google Play Store App Statistics 2021, which will blow your mind and provide you with a clearer perspective on the state of the Google Play Store in the Tech Industry and market.
1. Overall Number of Apps on Android Play Store
Google is one of the most trusted platforms, with millions of users using it on a daily basis. Google Pay app developers have begun to use this platform as a result of its popularity. This is why the number of apps on the Play Store is increasing. If you’re wondering how many apps are currently available in the Google Play Store, look no further.
As of the first quarter of 2021, there were 3.48 million apps on the Google Play Store. According to AppBrain research, this figure is expected to rise even further by the end of 2022.
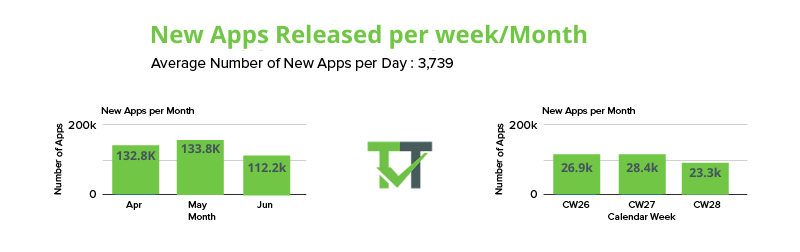
2. Total Number of Apps Released per Week and Month
There are no roadblocks on the way to increased demand for mobile apps. Every day, 3739 apps are added to the Google Play Store! When we talk about apps in billions, it may seem like a small number, but it adds up and leads to a significant increase in the number of mobile apps. In 2022, the consequences will be impossible to ignore.
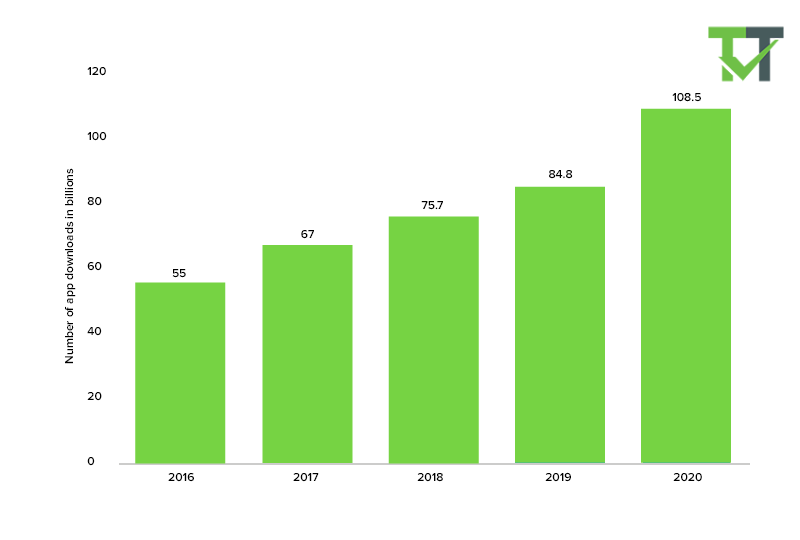
3. Total Number of Apps Downloaded Annually
Since there is a high demand for apps in every category and niche, the number of app download statistics per year has increased over the last two years. It is also due to the market’s rapid increase in demand for smartphones.
Google Play users worldwide downloaded 108.5 billion mobile apps in 2020, up from 76 billion in 2018. Because it is available for a wider range of devices, it generates significantly more downloads than the Apple App Store.
4. Total Number of Apps With 4 or Above Ratings
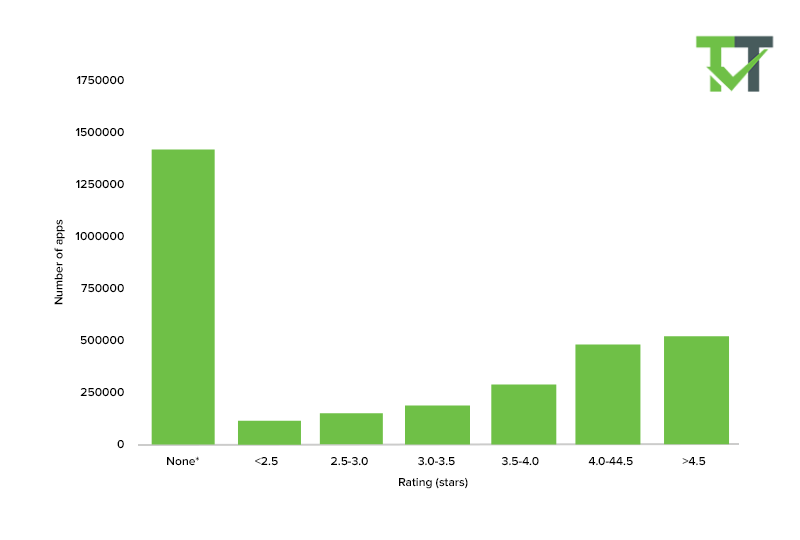
The majority of apps on the Google Play Store have higher ratings, which instills trust in users. According to Statista published research report, there were approximately 506,000 apps with an average rating of 4.5 stars or higher. In total, 1.49 million apps in the Google Play store had a rating, and another 1.39 million apps had below three user ratings.
By allowing users to rate apps on the Play Store, Google Play searches have enabled users and Google Play app developers to improve in the event that their apps receive low ratings (a step to achieve which is Play Store Optimization).
5. Google Play vs App Store Downloads
Google Play’s popularity is undeniable, as it increased by 16.4 percent between 2016 and 2018. That is, in the first half of 2019, the total number of installs reached 41.9 billion, a significant increase over the previous year’s figure of 36 billion. Take a look at the graph that compares Apple App Store statistics to Google Play Store statistics.
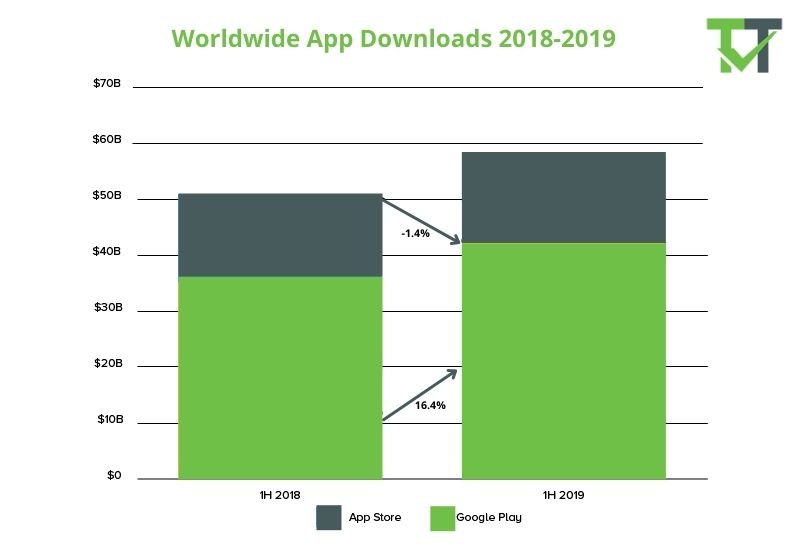
In terms of downloads, Facebook, WhatsApp, and Messenger are the top three Google Play apps, with a total of 880.4 million downloads. Meanwhile, TikTok continues to outperform Instagram.
6. Price Distribution
The average price of an app in Google Play searches, as shown in the histogram, is between $1 and $2. This data is compiled on the basis of apps priced under $10. To be more specific, there are approximately 44000+ apps under $1, and these are the apps that users prefer after experiencing the free model of an application.
Free and Paid Apps Downloads Statistics
Generally, two types of apps: paid apps and free apps. According to some studies, the Apple App Store has more paid apps than the Google Play Store. The reason for this is that Apple users tend to make more in-app purchases, which is one concrete reason why startups prefer the former in their Android vs iOS decision. We obtained top Google Play Store statistics 2021 in order to dissect the fundamentals of app distribution in the previously mentioned categories.
7. Free Android Apps
As of July 2021, 96.9 percent of all Android applications were free on Google Play. If you’re wondering how Google Pay app developers can make money when their apps are free, read on. After all, making money is the whole point, isn’t it?
You might be surprised to learn that the majority of revenue earned by mobile apps comes from free apps via app monetization strategies such as in-app purchases, accounting for 98 percent of app revenue worldwide. The overwhelming number of free apps on the Play Store indicates a significant shift toward the freemium model. This is why people prefer to create Android apps.
8. Paid Android Apps
If we talk about Paid apps on a personal level, you probably don’t have two paid apps on your device, don’t you? If you say otherwise, you are in the minority of the paid app demographic. Statista report says there are currently 3.1 percent paid apps on the Google Play Store.
Google Play Stats for Mobile App Usage
Generation X is a technology-dependent generation, particularly in terms of mobile apps. There are apps that can do everything in an instant. In light of this statement, we’d like to point out that nearly 21% of millennials open apps 50+ times per day, while 49% of the overall smartphone demographic opens an app 11+ times per day.
Furthermore, according to Google Play statistics, the average smartphone user uses 30 apps per month, if not more. These statistics may persuade you of the growing popularity of mobile apps, particularly on the Google Platform. Read on for more information on how these apps perform in various demographics and conditions.
9. Global Usage of Play Store Apps
In 2018, approximately half of the world’s population, or 3.9 billion people, were found to be online, and 96 percent of the world’s population lives within the reach of a mobile network.
According to GSMA real-time intelligence data, there are currently 5.27 billion people in the world who own mobile devices. This equates to 66.85 percent of the global population owning a mobile device.
It should be noted that many emerging markets, such as India and the Philippines, are mobile-first. This indicates that in these markets, consumers use smartphones as their primary internet access point. Furthermore, the majority of apps downloaded are for the Android platform, according to top Google Play statistics.
It goes without saying that now that everything is at our fingertips, the usage limit of apps and smartphones is bound to skyrocket.
With that said, it is safe to say that people all over the world are becoming more aware of and enthusiastic about technology. For your convenience, we have divided the app usage and download count in this Google Play Store Stats 2021 into categories.
10. App Usage by Age
It the widely assumed that younger generations, by definition, spend more time using mobile apps than older generations. There is no denying that generation X has grown up with technology and is more interested in technological trends.
However, this does not preclude you from targeting the other age groups. If you look at the graph, you will see app usage statistics based on the frequency with which apps are opened daily by people of various ages.
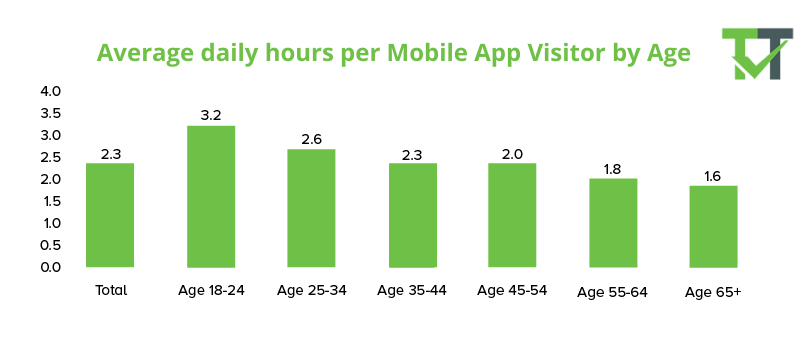
According to a study conducted in the United States, Millennials open apps the most frequently – 10.5 times per day on average (considering Millennials as 18-34-year-olds). Teens follow, at 9.4 times per day, a figure that is expected to rise. And, unsurprisingly, Boomers rank last in this category, with 5.5 times per day.
To summarise, according to Google Play statistics, US app users aged 13 to 64 open apps 8.3 times per day on average.
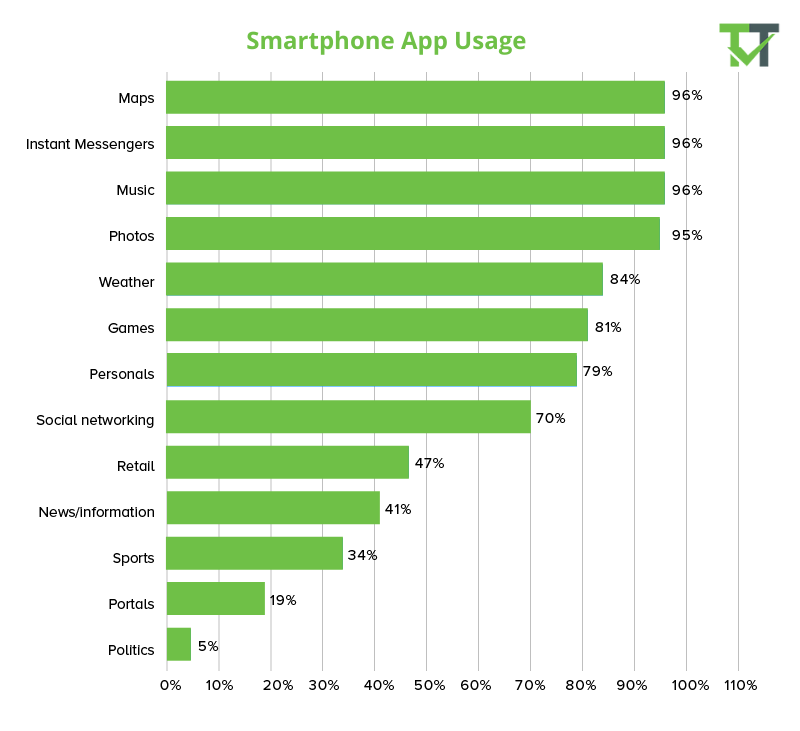
11. Usage by Devices
People no longer depend on a single device to access the internet; instead, they use a variety of Android devices such as tablets, smartphones, laptops, desktop computers, and so on. However, some research indicates that certain app categories have a high usage rate in Smartphones. Maps, instant messengers, music, games, photos, weather, and other applications are examples of such applications.
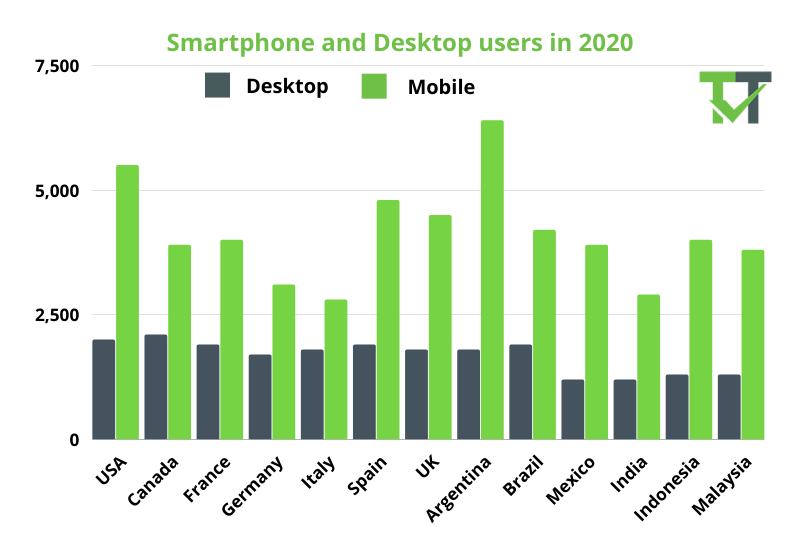
However, when it comes to desktop computers, their preference rate remains constant. It is most likely due to their incredible specifics, which make them ideal for certain purposes.
The amount of time spent on mobile in certain global markets has increased over time. According to the statistics provided below, Argentina has the highest amount of mobile time spent, followed by the United States and Spain. Italy, India, and Germany, on the other hand, have the lowest usage rates.
12. Usage by Country
Let’s take a look at the top Google Play Store statistics 2021 and see how people around the world use mobile apps. This data can be used by Google Pay app developers to learn more about the audience they want to reach and potential markets, which can help them plan app localization strategies.
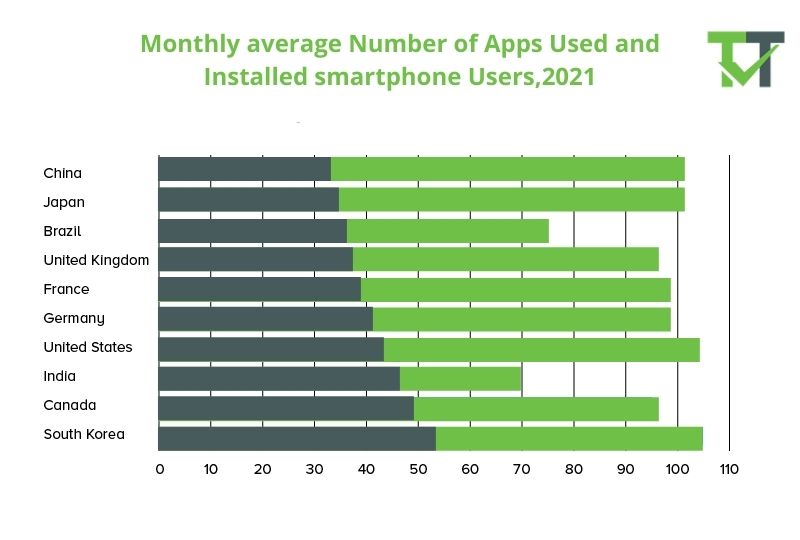
On a monthly basis, South Korea ranked first in terms of apps used and installed, followed by the United States and Japan.
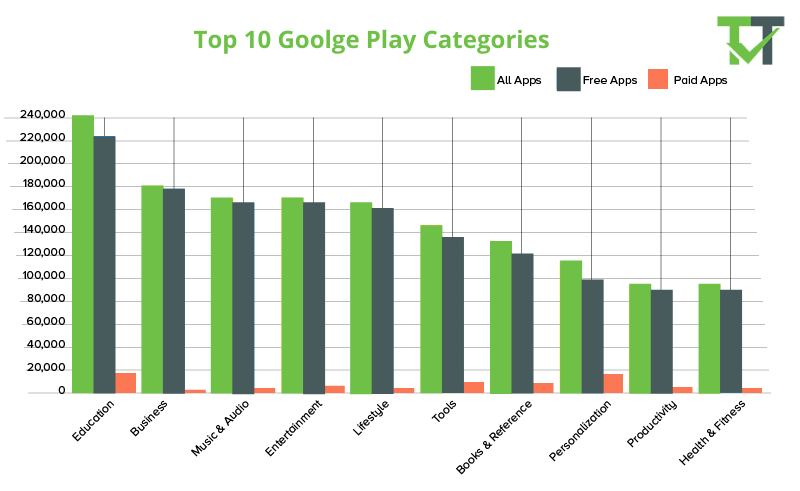
Most Popular Apps Categories in Google Play
Some categories, according to AppBrain, have a higher penetration rate than others. According to Google Play App statistics, Education apps are the most popular in the Google Play Store. It is followed by the categories of Business apps. The graph below depicts the number of paid and free apps available in the Google Play Store that are popular due to their high download rate.
13. Popularity of Entertainment apps
According to AppAnnie’s research, online videos viewed on mobile device screens will account for one-sixth of total media content consumed by users by 2021. This fact alone leads us to believe that there is a growing demand for and usage of this specific category, particularly in the Play Store.
It is estimated that there will be 2.6 billion mobile gamers in the world by 2020. This ever-increasing number undoubtedly generates a large amount of revenue for the Google Play Store.
14. Popularity of Gaming Apps
As the popularity of the gaming app grows, the average revenue is expected to increase at an incredible rate. Google Play had revenue of $31.9 billion as of 2020. It the predicted that by 2022, Android games will account for 56% of all mobile game revenue.
Here is a list of the top Google Play apps that have turned the world on its head, and everyone is influenced by their popularity, uniqueness, and utilitarian features.
15. Gross App Revenue
According to a Business Of Apps report, the iOS App Store and Google Play combined generated $111 billion in revenue worldwide in 2020, a 24 percent increase year on year. According to Google Play app statistics, the Google Play Store will earn $38.6 billion in 2020. Over the last four years, its revenue has increased by 167 percent.
So you can see how these Google Play Store economy statistics improve year after year. Add to that the fact that Google is constantly adding new plans, such as Google Rewarded Products, as a way to increase revenue earning potential for their Google Pay app developers, and we will not be mistaken in expecting the Google store to outperform the Apple store.